

Time to Start Hedging
Currently, U.S. equities are trading at levels comparable to historic peaks such as those seen in 1929 and 2000.
Refer to the chart below, illustrating the S&P 500 CAPE P/E (price-to-earnings) ratio.
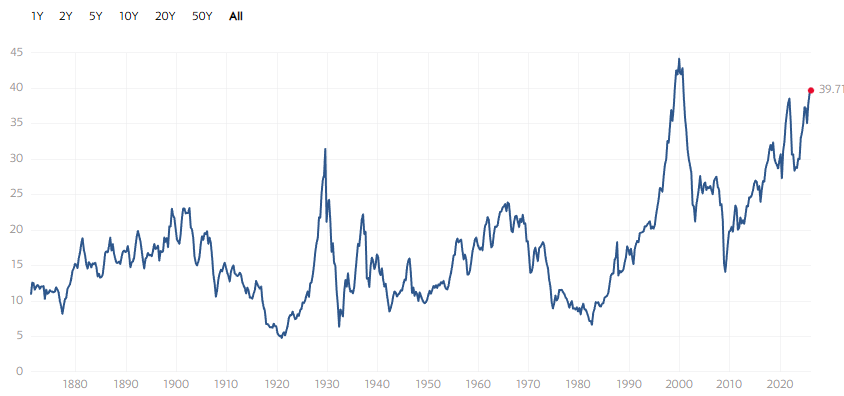
Source: Multipl.com
The CAPE P/E ratio is widely regarded as one of the most reliable indicators for assessing whether a stock or index is expensive. It evaluates stock prices relative to earnings over the previous decade.
This metric has a strong track record of signaling market tops. Apart from the current data point, the two most significant peaks occurred in 1929 and 2000—just ahead of two of history’s largest market crashes.
Warnings aren’t limited to the CAPE ratio. Consider the following chart, where red dots mark days when 115 S&P 500 stocks dropped by at least 7% within an 8-day rolling window.
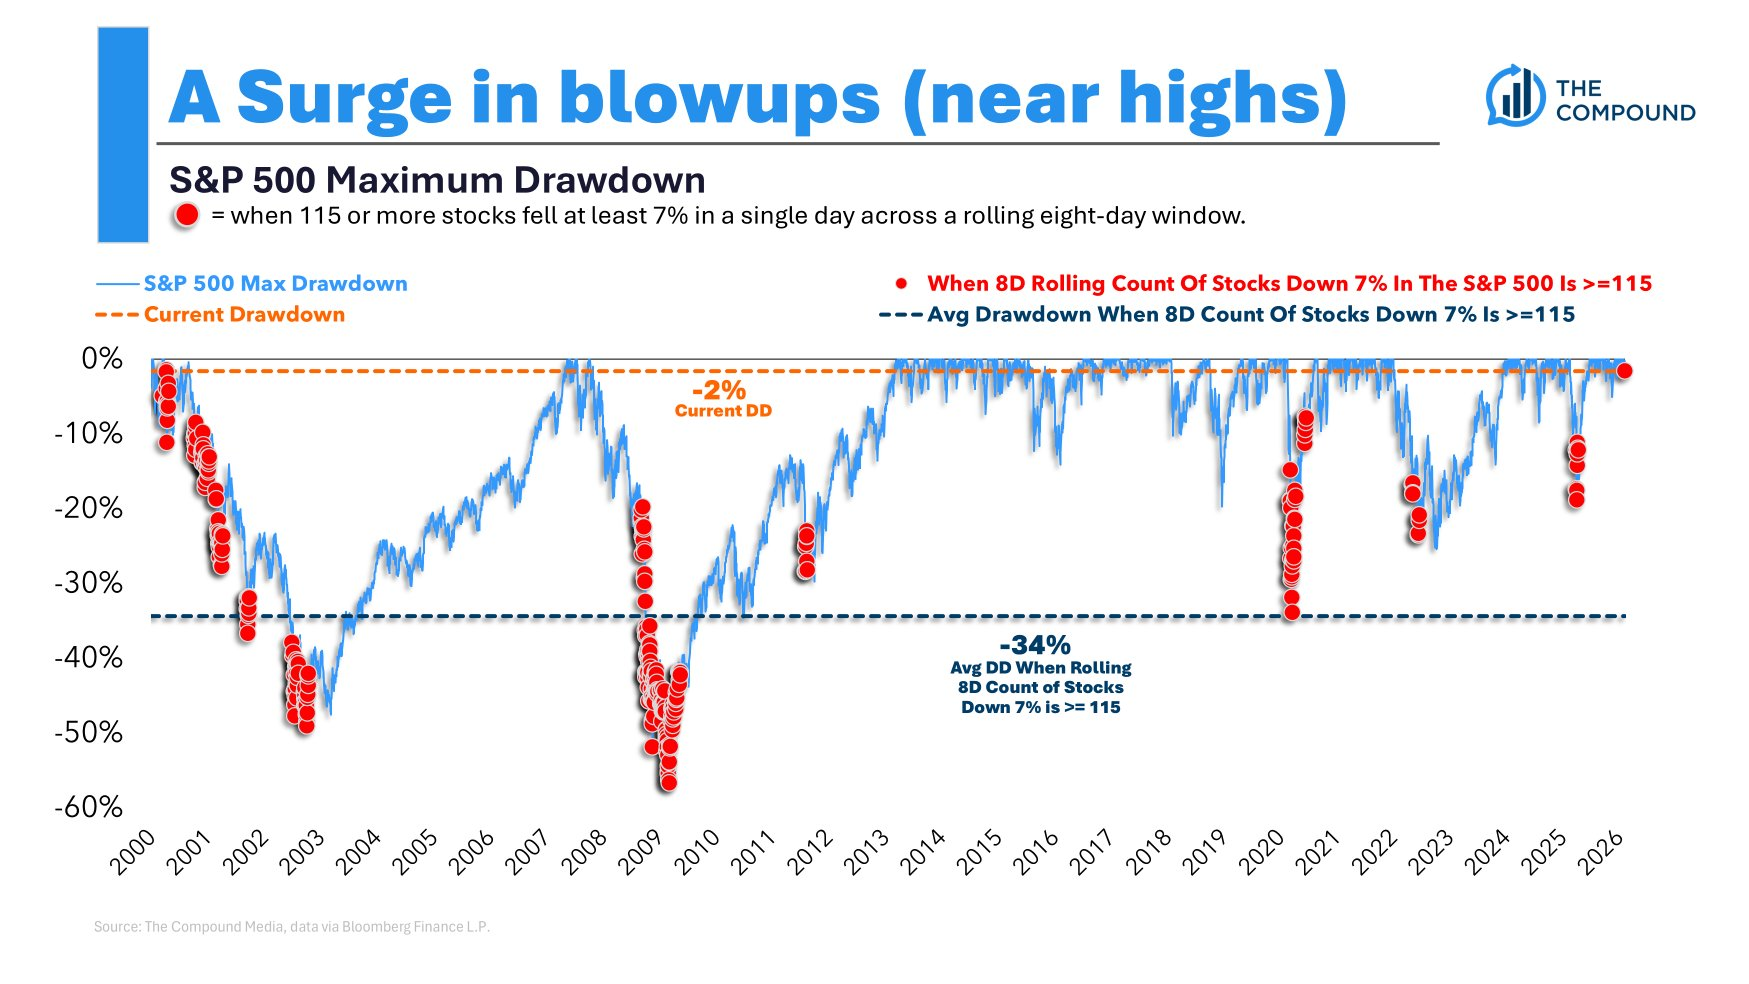
Source: Michael Batnick
While the market overall remains relatively steady, a significant portion of companies are experiencing sharp declines. Historically, this pattern has been a negative signal.
Here’s one more perspective: It’s been some time since we last checked the Buffett Indicator, Warren Buffett’s preferred tool for spotting when stocks become overvalued.
This indicator compares the total market capitalization of U.S. stocks to the nation’s GDP.
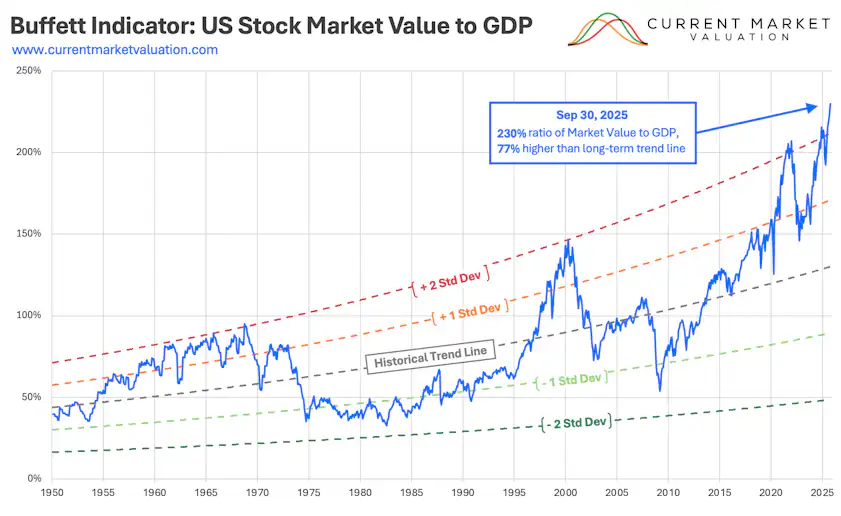
Source: Current Market Valuation
At present, the U.S. stock market’s valuation stands near $70 trillion, while GDP totals approximately $30 trillion. This places the Buffett Indicator at an unprecedented 230%, surpassing even levels seen during the dotcom crash of 2000.
Before the tech bubble of the late 1990s, this measure never exceeded 100%. Today, it sits more than twice that figure.
It’s true that profit margins for U.S. companies remain elevated and capital efficiency has improved. Still, these extremes are unlikely to be sustained.
Another angle involves the current dividend yield: The S&P 500’s yield clocks in at just 1.15%, which is remarkably low.
Ultimately, a correction is inevitable. Either companies must double their profits virtually overnight, or stock prices will have to drop significantly.
This fundamental risk explains our emphasis on alternative assets such as gold, silver, and emerging markets.
However, the time may soon arrive when acquiring downside protection becomes prudent. This could entail buying put options or taking short positions on indices like the Nasdaq or S&P 500. I recently initiated a modest hedge by purchasing some puts on major tech firms, although it remains a small allocation for now.
I don’t aim to sound overly cautious, but there are genuine concerns to consider.
Luckily, at Paradigm, we are fortunate to have skilled short sellers like Jim Rickards, Dan Amoss, and Mason Sexton—seasoned investors adept at navigating markets regardless of direction.
Short selling has faced challenges in recent years due to elevated stock prices, but it’s a strategy that tends to pay off significantly when downturns occur.
Still, avoid hastily shorting overpriced assets; that approach can backfire. For hedging, a sensible strategy involves purchasing long-term puts on broad indexes such as the Nasdaq 100 or S&P 500, with in-the-money puts providing a safer cushion.
Protecting your portfolio doesn’t require large exposure—a small position can offer valuable downside coverage. Allocating even 0.5% of your portfolio to LEAP puts can provide meaningful defense.
In my view, now is the moment to start adding some hedges.
If the market remains stable, that’s excellent. But should a downturn occur, having protection in place will be invaluable.