

The Semiconductor Bubble Goes Nuclear
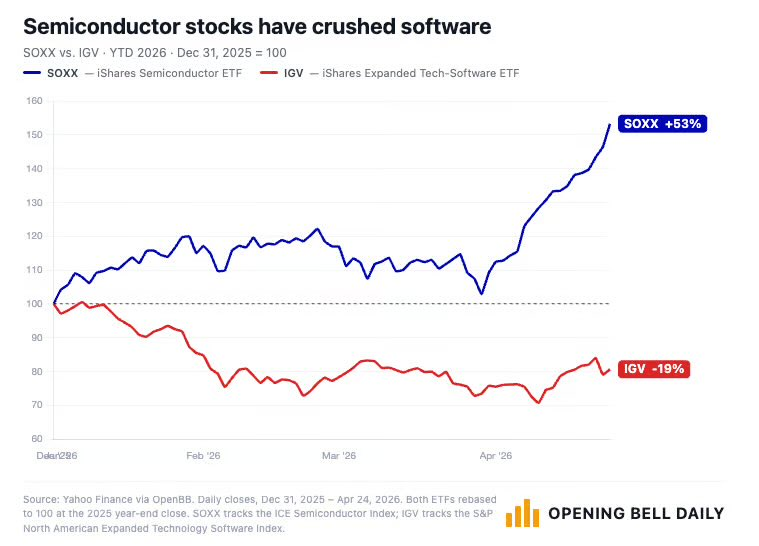
Over the last year, software shares have plunged while semiconductor stocks have surged dramatically.
The graph below illustrates that in 2026, semiconductor equities (blue) are significantly outperforming software stocks (red).
Source: Opening Bell Daily
Software companies include major names such as Microsoft (MSFT), Adobe (ADBE), and Figma (FIG). Investor concern around AI’s disruptive potential paired with inflated valuations has caused many to abandon this sector.
Conversely, the real gains are being captured by semiconductors (microchips). Firms like Nvidia (NVDA), AMD (AMD), Intel (INTC), and Qualcomm (QCOM) are delivering outstanding results.
These semiconductor businesses have been foremost beneficiaries of the AI surge, acting essentially as providers of the tools fueling this tech boom.
Intel (INTC) has been the standout performer recently, climbing from a low of $19 in August 2025 to its current value of $83.54. The company languished for years but entered a new era after securing U.S. government investment in August 2025, igniting its remarkable rally.
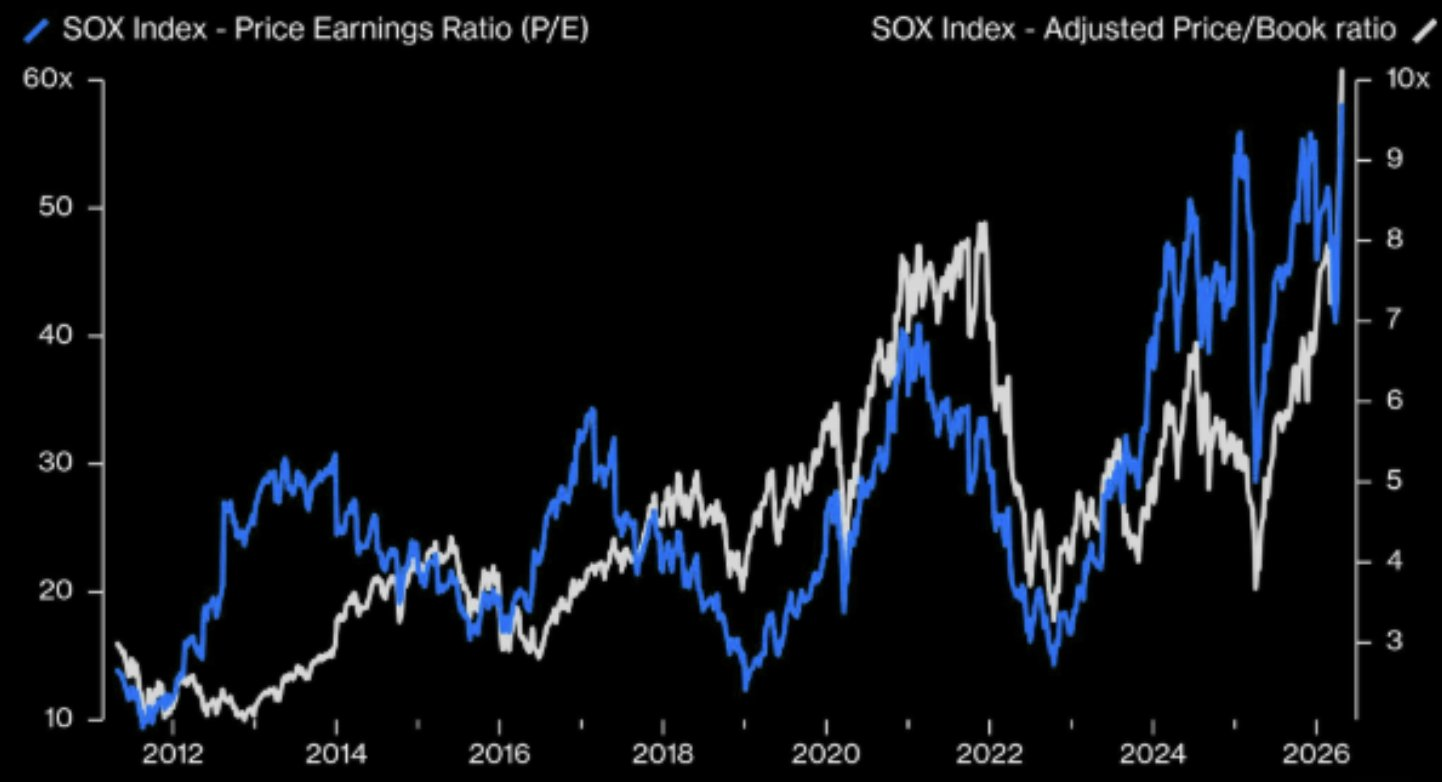
Despite this stellar run, semiconductor stocks have become notably pricey. The chart below presents the SOX semiconductor index’s P/E ratio (blue, left axis) alongside its price/book ratio (white, right axis).
Source: Bloomberg
Currently, the average semiconductor company trades at a P/E of 60, with a price/book ratio near 10.
To put this in perspective, a P/E of 60 means if earnings remain flat, it would take six decades for these stocks to earn back their market value. This implies investors are betting on sustained, strong growth over a very long horizon. While not impossible, it’s certainly lofty.
These metrics echo the excessive valuation levels reminiscent of the dotcom bubble. The chart below tracks semiconductor stocks’ share of the total market capitalization over more than five decades.
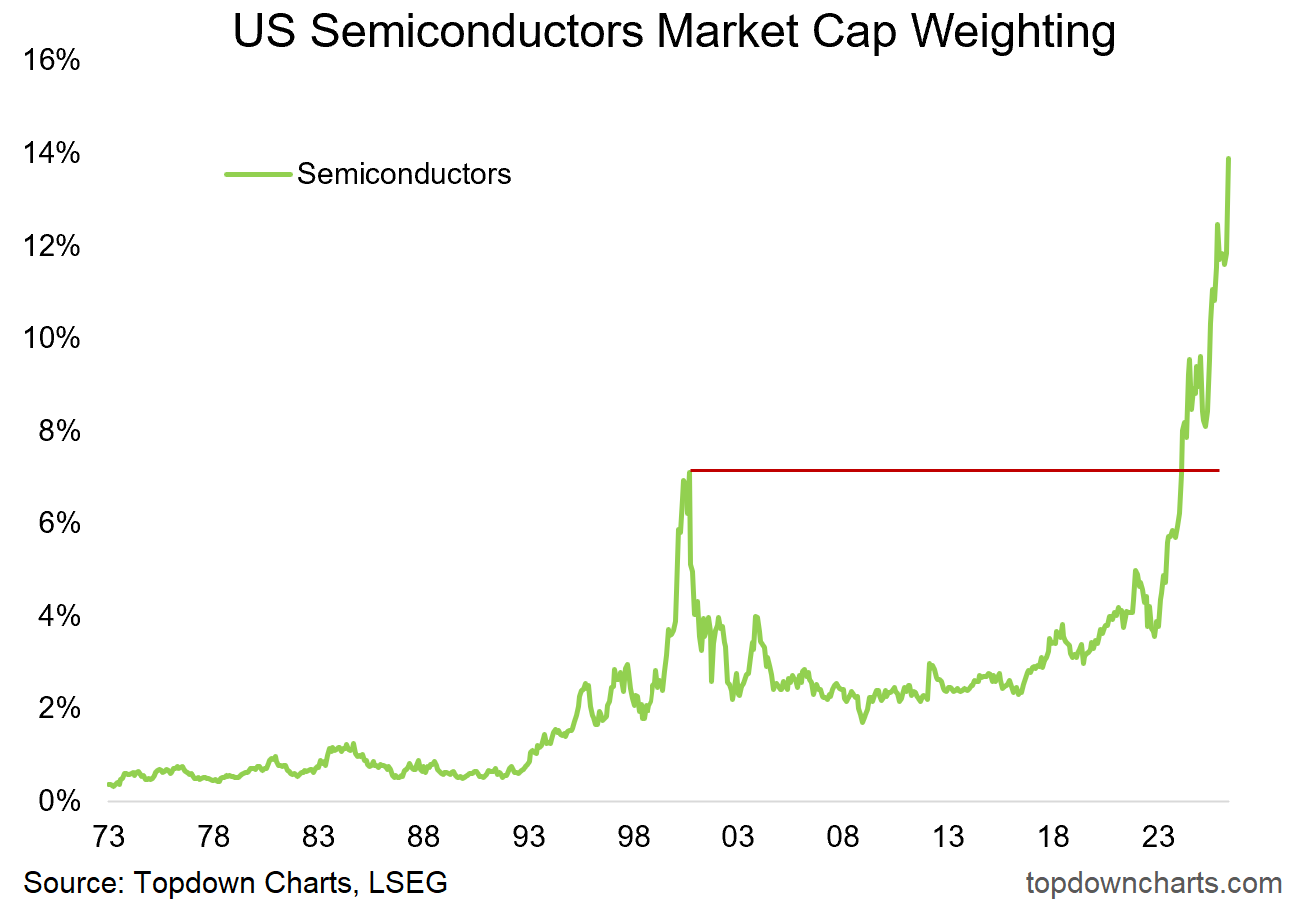
At present, semiconductor companies represent roughly 14% of the entire stock market’s value, which is twice their highest point back in 2000.
These shares appear significantly overbought, trading more than 40% above their 200-day moving average.
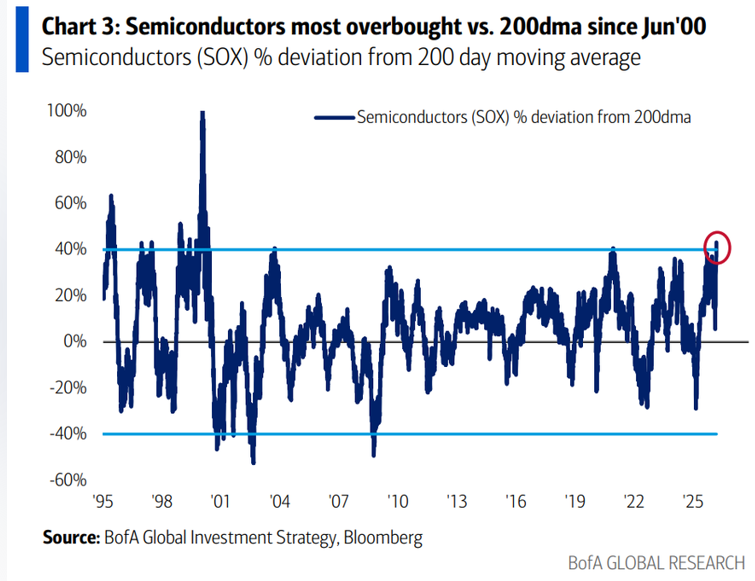
Back in 2000, semiconductor stocks briefly surpassed 100% above their 200-day moving average, suggesting there might still be some room to run this time.
However, in historical terms, these sharp surges usually conclude with a significant market correction.
During the 2000 bubble, Intel shares peaked at $75 before collapsing roughly 83% to near $12 by 2002. Notably, Intel only recently eclipsed its 2000 high, some 26 years later.
If you hold substantial positions in semiconductor stocks like Nvidia, Intel, or Qualcomm, now could be a prudent moment to lock in gains. Among them, Nvidia still appears to offer relatively better value. Nonetheless, when this bubble bursts, heavy losses will likely follow.
I believe a more favorable opportunity to purchase semiconductor or chip stocks will emerge within the next three years.
Undoubtedly, AI will be a pivotal force in tech moving forward, driving robust demand for semiconductors. But as chip-making efficiency advances rapidly, supply will eventually catch up with demand.
At that point, the bubble is likely to burst. Be sure to secure profits before you get caught in the downturn.