The EM Outperformance Cycle
Sometimes I encounter a chart so intriguing that I immediately decide it will feature in my upcoming newsletter.
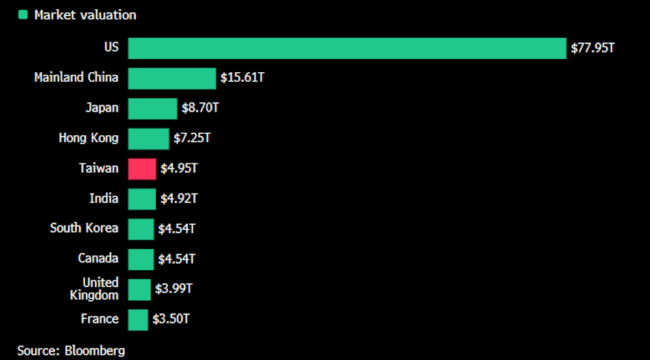
This is the latest example. It displays the valuation (market capitalization) of the top 10 stock markets worldwide by country.
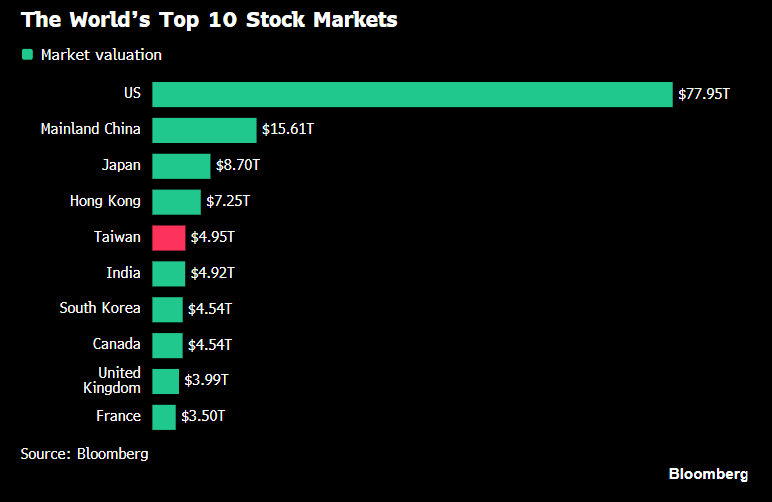
The U.S. stock market currently surpasses the combined value of the next nine largest ones, by a significant margin.
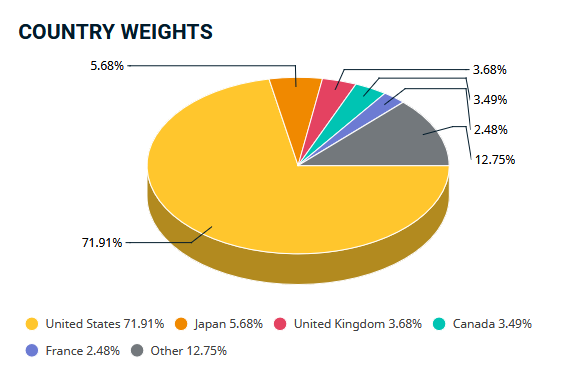
Within the MSCI World index, American stocks represent an enormous 72% of the total, even though the U.S. accounts for only 26% of global GDP. (Note: The MSCI World index includes only “developed” markets such as Japan and European countries.)
Source: MSCI
Though meant to reflect the “world,” the MSCI World index is predominantly composed of U.S. stocks at 72%. ETFs and institutional investors use this index as the basis for their investment portfolios.
This dominance largely stems from U.S. stocks outperforming global peers over many years, combined with the U.S. dollar’s strength as the world’s reserve currency.
Japan is the second-largest constituent after the U.S., representing 5.68%.
Here’s a surprising fact: during the 1980s, Japan’s share peaked at 44% of the MSCI World index!
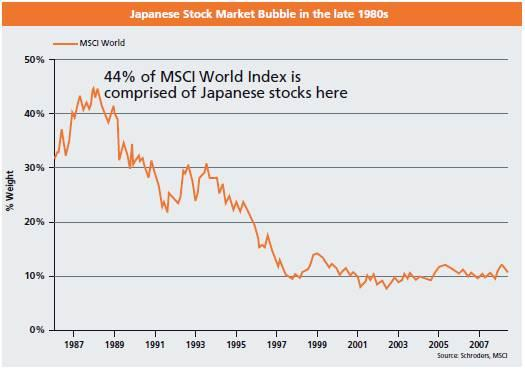
Back in the late 1980s, Japan’s market was actually larger than that of the U.S., despite having about one-third the population. It was regarded as an unstoppable economic powerhouse, excelling in automobiles, electronics, and manufacturing.
Japan’s stock market hit its peak in 1989 and only surpassed that high again in 2024—meaning over three decades of disappointing returns for Japanese equities. Although signs of recovery are emerging now, waiting 35 years was a lengthy ordeal.
Can America’s Run Continue?
The key question is whether the U.S. can keep outperforming every other market by a wide margin, or if the inevitable cycle shift is on the horizon.
Currently, U.S. valuations are quite elevated. The S&P 500 trades at an average price-to-earnings ratio near 28. This suggests that if companies paid out all their earnings as dividends, it would take roughly 28 years to recoup your investment, ignoring taxes and assuming no growth or decline in earnings.
An important consideration is the heavy concentration in technology-related stocks today. For instance, Nvidia (NVDA) alone composes 6.5% of the U.S. market value. While this concentration can deliver impressive gains during upward trends, it also introduces significant risks during downturns.
Below is a comparison of valuations across various global markets.
Global Stock Market Valuations (Price/Earnings) by Country ETF
- U.S.: 28 P/E (SPY)
- Brazil: 12 P/E (EWZ)
- China: 9 to 14 P/E (FXI and MCHI)
- Germany: 16 P/E (EWG)
- India: 23 P/E (INDA)
Compared to nations like Brazil, China, and Europe, American companies are trading at steep valuations. India is also pricey, which is why I tend to steer clear of it.
This premium for U.S. stocks is partly justified because America remains a hub for innovation and technological breakthroughs. Additionally, the dollar continues to serve as the primary global reserve currency despite its imperfections.
Nonetheless, the valuation gap has grown intense. Most Americans have minimal exposure to foreign equities, and even less to emerging markets (EM) such as Brazil. Personally, I favor EM over Europe, so that’s where my attention lies.
I believe we are entering a phase where emerging market equities will outperform U.S. stocks. The chart below illustrates this dynamic, with the S&P 500 in dark blue and the MSCI Emerging Markets index in light blue.
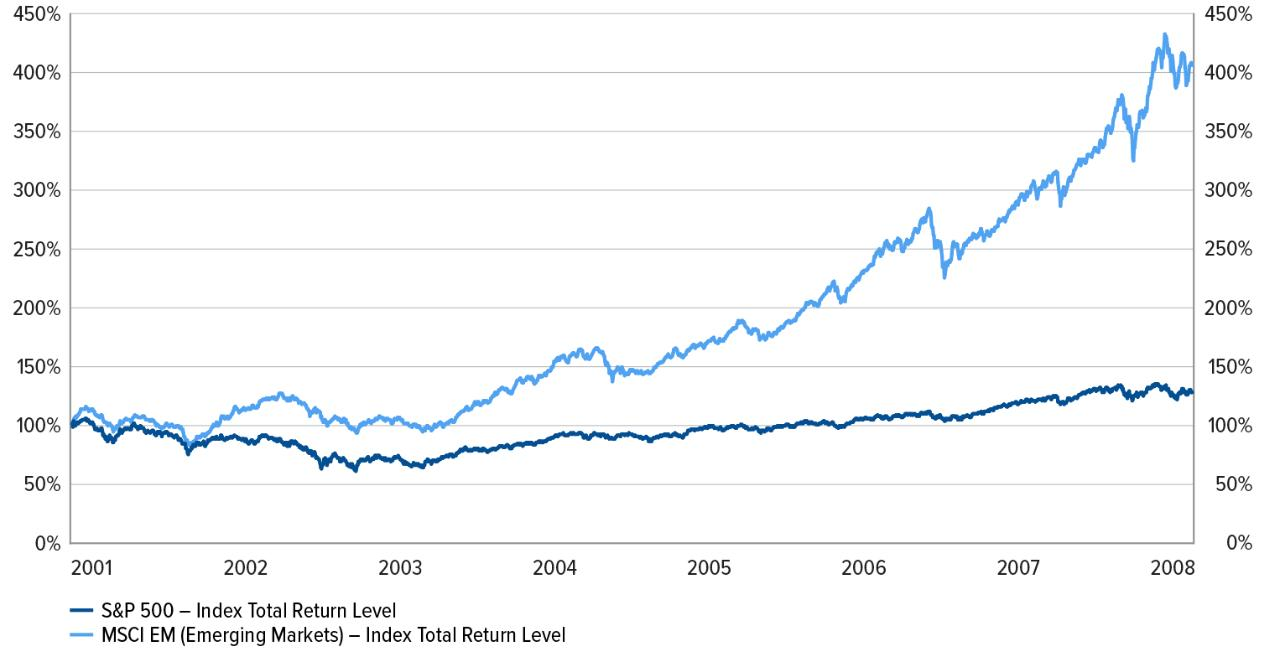
Between 2001 and 2008, emerging markets outpaced the U.S. by over three times.
This pattern follows a cycle: U.S. stocks soar for a period until they become overvalued. By then, emerging markets are widely overlooked, making them inexpensive and yielding attractive returns. This sets the stage for capital to rotate from the U.S. into EM.
That cycle appears to be unfolding now. Emerging markets are finally gaining momentum after more than 15 years of lagging performance. Brazil, which we’ve been highlighting for over a year, has returned 30% in that timeframe despite a recent pullback—slightly outperforming the S&P 500’s 28% rise amid the ongoing AI frenzy.
Taking relative valuations into account, EM is simply too undervalued to ignore. U.S. stocks are priced as though perfection will continue indefinitely, while EM valuations imply crisis-level fears.
To be clear, I’m not advising you to divest from U.S. equities. They are currently on a historic rally. But such strong runs eventually come to an end.
So, consider diversifying your portfolio by adding emerging market exposure. A straightforward approach is to hold a broad ETF like Vanguard’s VWO, which provides wide-reaching access to EM stocks with an ultra-low expense ratio of 0.06%—essentially negligible in cost.
My top EM choice remains the iShares Brazil ETF (EWZ). Although EWZ has retreated from recent highs, it remains affordable, offers high dividends, and is trending upward.
At present, the majority of global investors are heavily invested in U.S. stocks—a strategy that has paid off handsomely over the past decade and a half. However, now is the moment to begin increasing diversification.
When the current AI-driven enthusiasm ultimately cools off, having substantial exposure to emerging markets will prove rewarding—just as it did during the post-dotcom period from 2001 to 2008.
About the Author